
Background
The Alaska COVID-19 Weekly Case Update will be composed every weekend with data from the previous week and the report will be published by the following Wednesday. Data are continually updated on the AK DHSS Data Hub, which reflects the most current case counts. This summary presents data from the previous week and is a snapshot of the information available on known cases at the time.
Highlights
We continue to see new cases of COVID-19 in Alaska.
The majority of new infections among Alaskans are from community spread, not from travel, meaning that most Alaskans get the virus from someone they work, socialize, or go to school with.
Many Alaskans who are diagnosed with COVID-19 report that they went to social gatherings, community events, church services and other social venues while they were contagious but before they knew they had the virus.
Cases disproportionately affect Alaska Native People and that proportion is rising; Alaskans who identify as Black or Pacific Islander are also disproportionately impacted although the numbers of people affected in these populations are smaller, making it more difficult to judge whether these differences will be statistically significant
Many cases are still under investigation and race is not yet known.
Hospital occupancy statewide remained between around 50% and 60% this week, however this number includes beds in smaller hospitals that do not usually accept patients transferred from larger communities.
Alaskans should avoid gatherings, wear masks when around any non-household member, keep six feet of distance from anyone not in their household and wash hands frequently to slow community transmission of COVID-19.
New cases
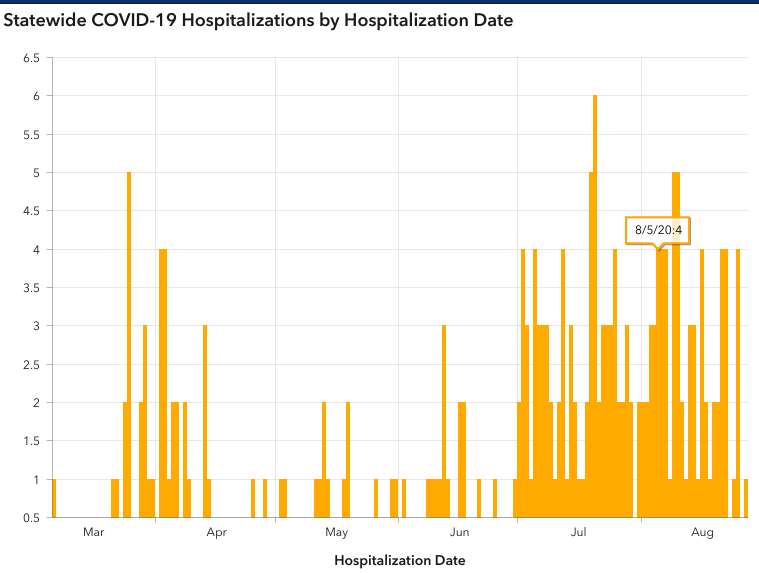
This week saw 491 new cases in Alaskans and 21 in nonresidents, for a total of 5,226 and 860 respectively. Several cases previously classified as resident cases have since been reclassified as nonresident cases after further investigation took place. 18 additional Alaskans required hospitalization this week for COVID-19, for a total of 215 since the epidemic began. Five additional deaths were reported this week, for a total of 37. By convention, deaths are counted based on the residency of the patient rather than where they contracted the virus.
Cases occurring in schools
As school starts around Alaska, several cases have been identified in conjunction with schools or school sports, including several cases identified in Matanuska-Susitna Borough schools, one case identified in a high school football player in Fairbanks North Star Borough, and several cases identified in conjunction with the UAF hockey team.
The divisions of Public Health and Epidemiology are working closely with school districts to respond to cases in school, conduct contact tracing, investigate whether there has been any spread within schools and determine when it is reasonable to reopen.
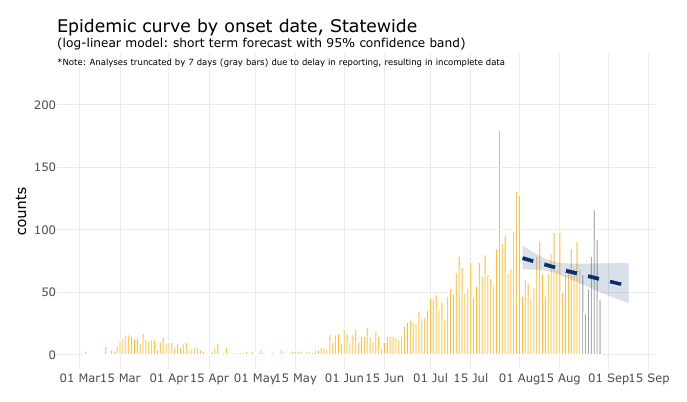
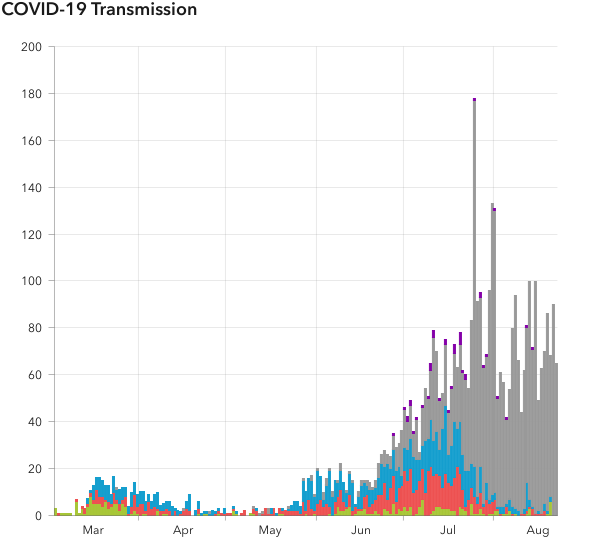
Epidemic curve
This analysis projects growth or reduction in cases predicted in the coming weeks based on the growth of cases in recent weeks. The most recent 7 days (grey bars) are not included because there can be a delay in reporting data. This model assumes exponential growth or reduction in cases and can be a useful tool to visualize how quickly cases are increasing or decreasing. This curve does not project what might happen if more people start wearing masks or increase physical distancing; it assumes Alaskans and visitors to Alaska do not change their behavior. The dotted line is the average prediction, and the grey shaded area is estimated error for the predicted rise in cases. For a full description of methods, visit https://coronavirus-response-alaska-dhss.hub.arcgis.com/
Currently, cases are predicted to halve about every 75 days based on the current case trend, a slight improvement from last week, when cases were predicted to halve every 90 days. Keeping the case trend prediction downsloping will depend on a continued effort among Alaskans to slow the spread of transmission through physical distancing, masks and limiting contacts.
Communities affected this week
New cases were found in Alaskans who are residents of the following communities:
- Anchorage (269), Chugiak (1), Eagle River (6), for a total of 276 in the Anchorage Municipality
- Bethel (4) and smaller communities in the Bethel Census Area (16) for a total of 20
- Fairbanks (71), North Pole (6) and one in a smaller community, for a total of 78 in the Fairbanks North Star Borough
- Juneau (11)
- Kenai (4), Homer (1), Soldotna (5) and one in a smaller community, for a total of 11 in the Kenai Peninsula Borough
- Ketchikan (4)
- Wasilla (26), Palmer (9), Sutton-Alpine (2) and 1 in Willow for 38 in the Mat-Su Borough
- Nome (2) and 6 in a smaller community or communities, for a total of 8 in the Nome Census Area
- Utquiagvik (9) and one in a smaller community, for a total of 10 in the North Slope Borough
- Kotzebue (1) and 3 in a smaller community or communities, for a total of 4 in the Northwest Arctic Borough
- 5 in communities in the Prince of Wales-Hyder Census Area
- Sitka (4)
- Unalaska (2)
- Cordova (1), Valdez (2), and one in a smaller community, for a total of 4 in the Valdez-Cordova Census Area
- Wrangell (2)
- Yakutat plus Hoonah-Angoon Census Areas (9)
- Yukon-Koyukuk Census Area (5)
Case rates and alert levels
7-day Case Rate Map (cases per 100,000 people)
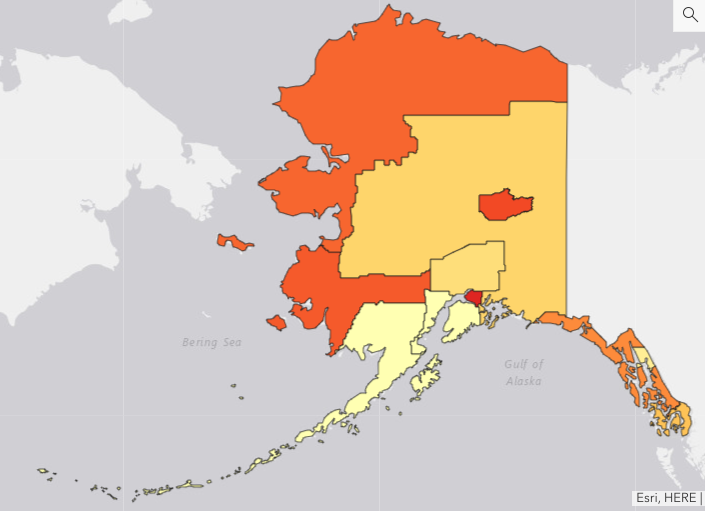
The 7 day case rate map depicts cases adjusted by population for a given region (cases per 100,000 people). The regions are large because Alaska is a large state with few densely populated centers, so this case rate can only be meaningful across large regions.
Regions with increased rates this week included the Anchorage Municipality (13.1 from 11.7), Fairbanks North Star Borough (11.5 from 10.3), Y-K Delta Region (10.9 from 4.9), the Southern Southeast Region (6.5 from 5.7) and the Northern Southeast Region (9.1 from a rate too small to calculate last week).
Among improved regions are the Northwest region, still high at 10.4 but improved from 15.6 last week, the Interior Region at 5.5 from 9.8, Mat-Su (5.0 from 7.7), Kenai Peninsula Borough (2.7 from 7.7), and Juneau City and Borough (4.0 from 6.7).
Most states use a 7 day case rate per 100,000 population to estimate trends in community transmission. Roughly, rates of >10 cases daily per 100,000 population correspond to widespread community transmission and >5 to moderate community transmission, but a sharp increase or decrease in these rates can help predict how the next week or weeks will look for the region.
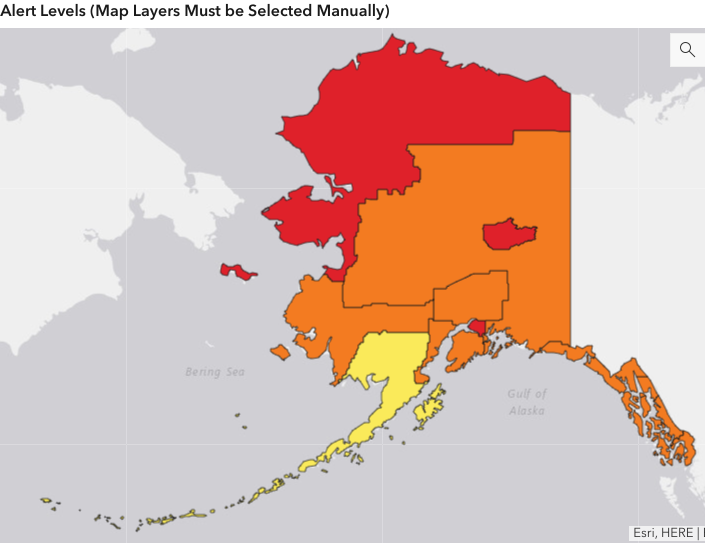
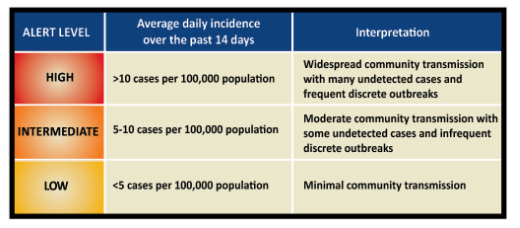
Because of Alaska’s unique geography and smaller population, a 14 day case rate can also be useful. The alert level map above, designed to help long term facilities decide when it may be safer to allow visitors in their facilities, uses a 14 day case rate approach.
In high alert level (red) is the Northwest Borough (12.7 from 11.7 last week), Fairbanks North Star Borough (10.8 from 8.3), and the Anchorage Municipality (12.6 from 13.0).
In intermediate alert level (orange) is Kenai Peninsula Borough (5.8 from 9.1), the Interior Region excluding Fairbanks (7.9 from 10.4), Juneau City and Borough (5.1 from 11.6), Matanuska-Susitna Borough (6.2 from 6.4), the Y-K Delta Region (7.3 from 5.4), the Northern Southeast Region (6.3 from 4.5), and the Southern Southeast region (6.1 from 6.5).
In low alert level (yellow) is the Southwest region (1.7 from 3.5).
More information on alert levels is available on this page.
How Alaskans acquired COVID-19
DHSS monitors how people most likely got the virus. In green in the plot below are Alaska residents who acquired COVID-19 by traveling to other states or countries. In March, a substantial proportion of our cases were related to Alaskans returning from elsewhere, while in April and May, fewer Alaskans traveled. Since June, as travel has started to increase, cases in Alaskans related to travel have begun to occur more regularly.
In blue below are cases where Alaskans got COVID-19 from a known contact. These are people who did not leave the state, but we could trace their illness back to the person they got it from. The goal is for contact tracing to identify each of these cases where someone got it from someone else they had contact with so they can let all other contacts of both people know to quarantine. As contact tracing expanded in May, more cases from contacts were identified.
In red, however, are cases where Alaskans got COVID-19 and contact tracing was not able to establish a clear source. This demonstrates that there are other cases in our communities that we have not found yet. The biggest increase in cases in Alaska has been in people aged 20-39, with many cases linked to bars and social gatherings.
Grey bars show the cases where the investigation has not yet concluded. Since the workload for contact tracers has more than doubled in the last few weeks, they are working as fast as possible to identify and quarantine contacts. Alaskans can help contact tracers move faster and prevent more cases by keeping their contact list small, keeping a diary of who they are in close contact with (defined as within 6 feet for 10 minutes or more), wearing cloth face coverings when around any non-household members or in public, and responding promptly to being contacted.
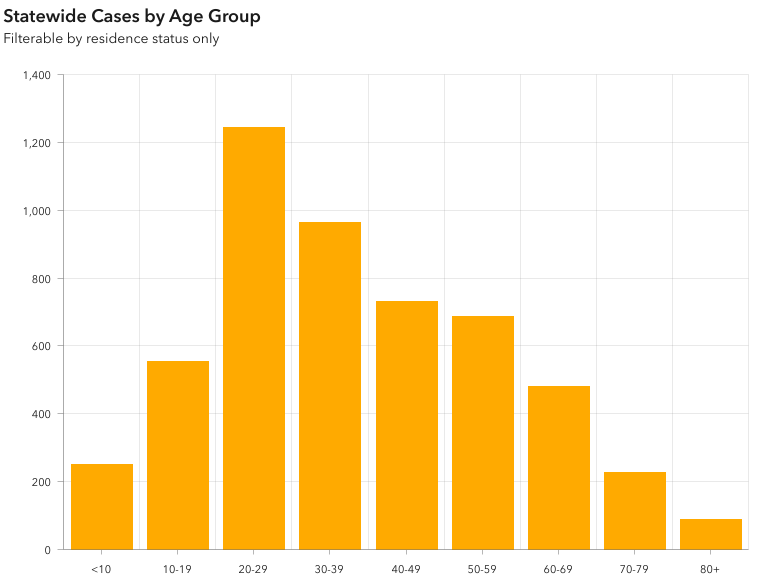
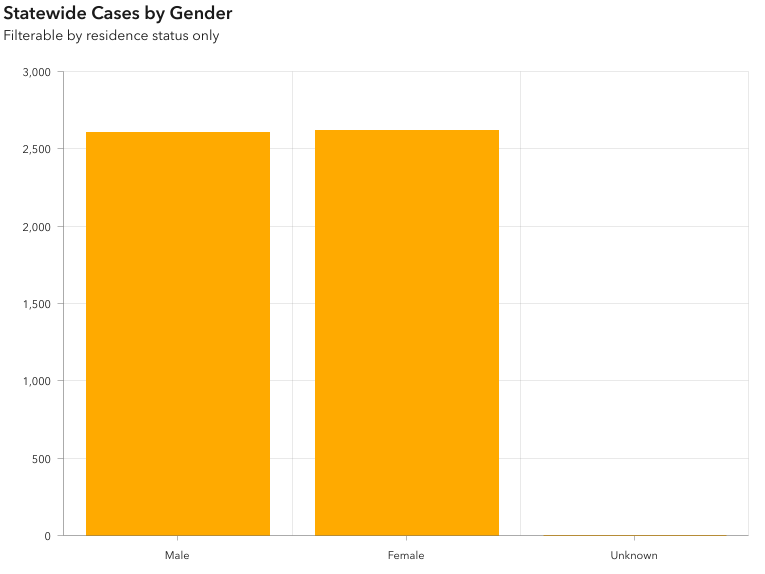
Age and gender distributions
More COVID-19 cases have been found in adults aged 20-39 than any other age group. Gender distribution has been close to equal, with slightly fewer than half of cases in males and slightly over half in females.
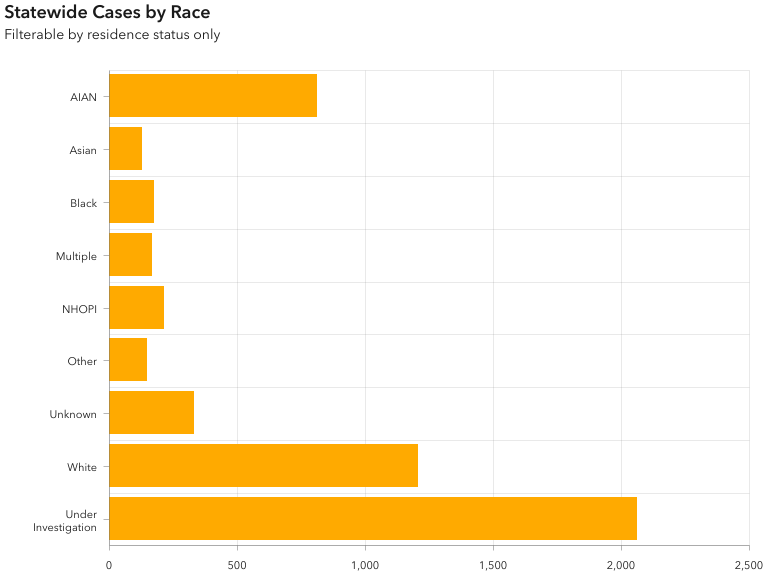
Distribution of cases compared to population distribution
Includes data from all cases reporting one or more races.
Based on these data, American Indian and Alaska Native as well as Native Hawaiian and Pacific Islander populations are disproportionately affected.
Race | Number of cases | Percent of cases (of those for whom a race is known) | Percent of Alaska population |
American Indian and Alaska Native | 810 | 29% | 16% |
Native Hawaiian and Pacific Islanders | 212 | 7.5% | 1% |
Black/African American | 173 | 6.1% | 4% |
Asian | 126 | 4.4% | 7% |
Multiple | 165 | 5.8% | 8% |
White | 1205 | 42% | 65% |
Other race | 146 | 5.1% | |
Total for whom a race is known | 2837 | ||
Under investigation | 2060 | ||
Race unknown | 329 |
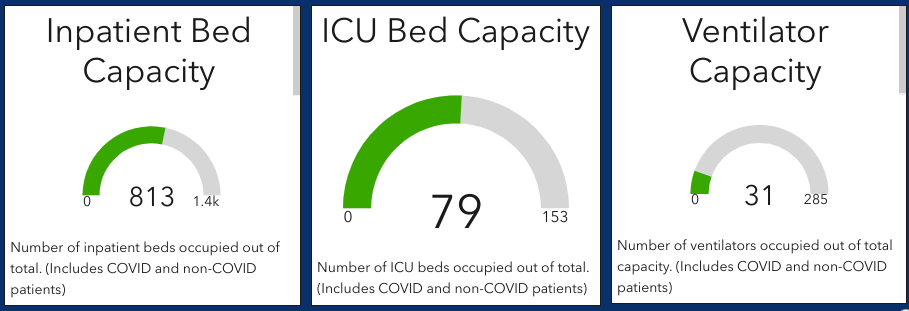
Hospital capacity
Hospitals report all inpatient beds in this total, including those for infants and obstetrics. However, the ICU bed count includes only staffed adult and pediatric ICU beds, as NICU (neonatal ICU) beds can only be used for infants and would not be useful for teenage or adult patients with severe COVID-19.
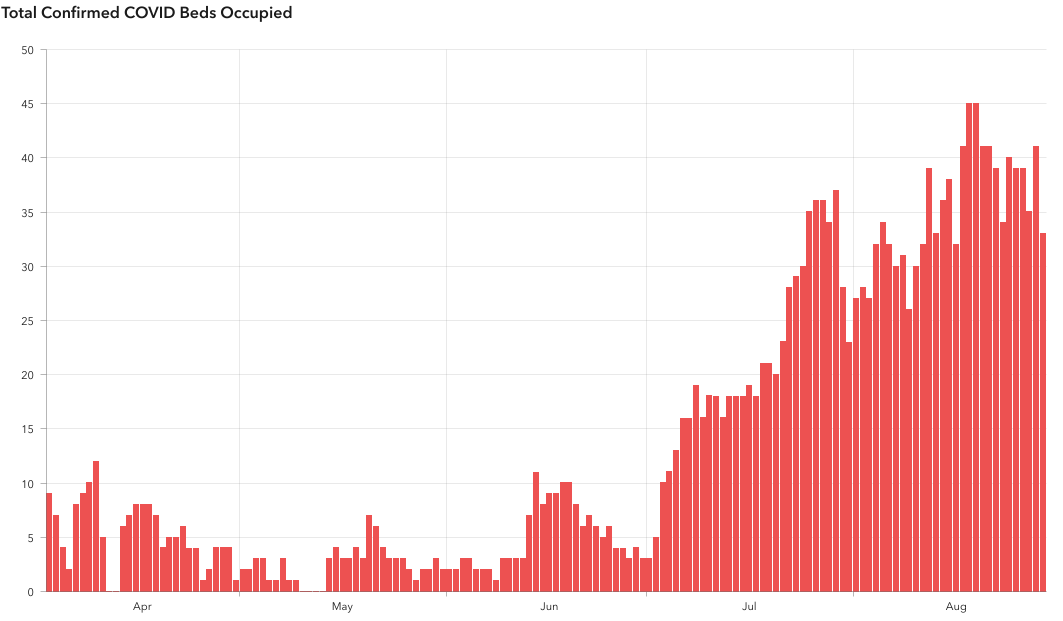
Hospitals remain below capacity, with ventilators and ICU beds available, but use continues to slowly rise. 215 Alaskans have required hospitalization for COVID-19. Bed occupancy due to COVID-19 rose in July, following a rise in cases, and has not yet significantly decreased.
Risk of severe COVID-19 by race and ethnicity
CDC notes that older adults and people with underlying medical conditions are at increased risk for severe illness if they get COVID-19. In particular, CDC specifies cancer, chronic renal disease, COPD, immunocompromised state from a solid organ transplant, obesity (BMI 30 or higher), serious heart conditions such as heart failure, coronary artery disease and problems with the heart muscle, sickle cell disease and type 2 diabetes as carrying an increased risk of severe illness.
Data was immediately available for the prevalence of several of these conditions among Alaskans. Because Alaska’s population is small and the data collected is even smaller, several of these estimates are considered statistically unstable, or not very reliable. However, they are presented here as an example of how different chronic diseases impact different populations of Alaskans, and they may be able to predict increased risk of severe COVID-19 among some populations.
Race or ethnicity | Cardiovascular disease | COPD | Diabetes | Obesity | Current smoker |
Multiple races, non-Latino | 3.3%* | 2.4%* | 7.2% | 28.6% | 12.9% |
Hispanic or Latino | 5.2%* | 5%* | 10% | 23.1% | 25.5% |
White | 4.2% | 5% | 8.3% | 30.6% | 15.9% |
Native Hawaiian or Other Pacific Islander | No data available | No data available | 6.6%* | 55.4% | 17.9% |
Black or African American | 8%* | 6.1%* | 17.2% | 44.3% | 20% |
Asian | No data available | 2.9%* | 8.6% | 18.7% | 8.5% |
Alaska Native | 4.6% | 7.4% | 7.8% | 36.3% | 36.8% |
*Statistically unstable: there is not enough data for this category to consider this a reliable estimate
Hospitalizations and deaths by race and ethnicity
Hospitalization percentages are influenced both by the number of people of that race hospitalized and the number of people of that race who have been found to have COVID-19. This means that a population that either has a high degree of severity of COVID-19 and/or a low rate of testing and many undiscovered cases may have a high percent hospitalized shown in state data. Conversely, a population that has many hospitalizations but has a disproportionately high testing rate may have a lower percent hospitalized relative to other groups, since they have fewer undetected cases.
Because Alaska has had 37 deaths related to COVID-19, it is very difficult to draw robust conclusions from these small numbers. Hospitalizations may be a better indicator of actual severity among different populations, since those draw from larger numbers. Other states have had far larger numbers of hospitalizations and deaths and can draw conclusions about trends with more confidence.
Disparities in severity among Alaskan populations have begun to trend towards mirroring those in other states. However, state and federal data reflects significant racial disparities in the impact of COVID-19 on minority communities, and Alaskan populations such as Alaskan Native People and Pacific Islanders are known to experience conditions that place them at higher risk for severe COVID-19 at increased rates compared to other groups. Racial disparities in these numbers may be best interpreted as proxies for differences in contributing factors such as rates of medical comorbidities, exposure risks, and ready access to medical care. Care should be taken not to interpret racial disparities as inherent biological differences among races.
Race | Number of cases | In cases of that race, percent who were/are hospitalized | In cases of that race, percent who have died |
Native Hawaiian and Pacific Islander | 212 | 19% | 2.4% |
Asian | 126 | 9.5% | 2.4% |
American Indian and Alaska Native | 810 | 6.4% | 1.6% |
Black/African American | 173 | 3.4% | 0% |
Multiple races | 165 | 1.8% | 0% |
White | 1,205 | 5.7% | 1.2% |
Other | 146 | 4.8% | 0% |
Unknown or not yet identified | 2,389 | 1.0% | 0.04% |
All cases for which a race is known | 2,837 | 6.7% | 1.3% |
All cases | 5226 | 4.1% | 0.7% |
Reporting of deaths due to COVID-19
Although several of these deaths occurred in Alaskans who acquired the disease in another state and never traveled to Alaska during their illness, they are counted as deaths in our reporting by national convention. In accordance with national standards, case counts for Alaska reflect known cases in all Alaska residents, regardless of where they acquired the infection or where it was discovered. This provides consistency and avoids cases and deaths being double-counted between states. Cases found in Alaska that are not among Alaska residents are reported under nonresident cases.
37 Alaskans are reported as having died from COVID-19.
Recovered cases
480 Alaskans are presumed to have recovered (either they have been confirmed by public health as recovered or they have completed 10 days of isolation) from COVID-19 this week, for a total of 2,039, or 39% of total cases.
Nonresident cases
Of the 21 nonresident cases identified this week, 1 was in the Aleutians West Borough, 7 were in the Anchorage Municipality, 1 was in the Bethel Census Area, 7 were in the Fairbanks North Star Borough, 1 was in Juneau City and Borough, 1 was in Ketchikan Gateway borough, and one was in the Nome Census Area. Two nonresident cases did not yet have their location identified.
2 nonresident cases were associated with the seafood industry, 2 with tourism or visiting purposes, 2 with mining, 1 with airlines and 5 with other industries.
Test positivity rate
The test positivity rate is the percentage of tests performed in a given area that come back positive. While the positivity rate is not a standalone measure of the amount of viral transmission in a region, it helps visualize whether the testing being conducted is sufficient to meet the need to detect viral transmission in that region. Lower test positivity rates are better, since they reflect more tests being performed to find each positive case. Positivity rates over 5% are concerning because they may indicate that testing is insufficient or that there is significant ongoing viral transmission.
In the map below, the Anchorage Municipality has the highest positivity rate, at 3.2%, up from 2.2% last week. The Valdez-Cordova Census Area has the second highest weekly positivity rate, 1.7%, and the Matanuska-Susitna Borough is third with a rate of 1.5%. Fairbanks North Star Borough had a rate of 1.3% and West Aleutians and Bethel Census Areas had rates around 1%. All other regions had rates less than 1%. The overall state positivity rate this week was 1.9%, improved from last week’s rate of 2.2%.
Alaska’s overall positivity rate, of 346,839 tests total, has remained between 2% and 3% in recent months and has not exceeded 4% during the pandemic so far. Testing turnaround time averaged 2.6 days in the last two weeks at the state lab, 3.6 days at facilities and 3.1 for commercial labs for all tests reported in Alaska.

Contact tracing
Ongoing contact tracing has uncovered many cases in Alaskans who have had possible exposures related to group activities. These include churches, residential living facilities, workplaces, bars and social gatherings. Alaskans should be aware that any gathering, particularly indoors, poses some risk of exposure and should take steps to minimize their risk and the risk they pose to others by keeping their social circles small, wearing face coverings, avoiding large gatherings, and gathering only if it is possible to remain 6 feet apart, ideally outdoors. Contact tracing has become even more resource intensive in recent weeks with both an increase in new cases and a marked increase in the number of contacts each person has- meaning that people are expanding their social circles even as case rates increase.
Tourism, visitors and airport testing
Airports report data on a Saturday through Friday cycle, meaning that the airport screening numbers in this section reflect data collected on Saturday, August 22nd through Friday, August 28th.
Travel data was significantly impacted by delays in reporting this week. Several airports had not yet reported complete data at the time of this publication. One airport found that several travelers had completed more than one travel declaration form. For that reason, these numbers should be interpreted as preliminary estimates only.
This week saw 21,052 travelers screened at airports entering Alaska, and 3,536 (17%) were tested on entry. 1,173 Alaskans selected a 14 day quarantine (6% of total travelers). 13,329 provided proof of another test performed within 72 hours of landing in Alaska (63%). The remaining 3,014 (14%) provided proof of having recovered from COVID-19, were essential workers following a community and workplace protection plan or were Alaskans who had been gone for fewer than 24 hours. One positive result from the tests performed at the airport has been reported so far, for a test positivity rate of <1%, however several airports have not yet reported positive tests for the week.
Since testing began twelve weeks ago, 231,502 travelers have been screened at Alaska airports. 111,774 (48%) tested prior to travel, 66,375 (39%) have tested in Alaska airports, and 25,504 (11%) selected a 14 day quarantine. There have been 382 positive tests through airport testing, for an overall test positivity rate of 0.6%.
Of the 21 cases in nonresidents this week, two were linked with a visitor, in Anchorage Municipality and Nome Census Area.
Seafood industry
Of 21 nonresident cases total identified this week, 2 are in workers in the seafood industry, one in Anchorage Municipality and one in Aleutians West Census Area. All nonresidents with COVID-19 are quarantined and contact tracing is ongoing for these cases.
Data timeliness and accuracy
Weekly summaries are published early the following week because that gives the state public health workforce time to collect data, verify accuracy, make sure cases have not been counted in multiple places and verify patient identities. This summary is designed to review a week’s data from the Alaska Coronavirus Response Hub dashboard, which displays same-day or next-day data. The dashboard data occasionally changes as new information is received or as cases are reclassified once verification takes place, since this process takes time. Weekly summaries reflect our most current and complete knowledge about cases in the previous week.
Further information
Please see the State of Alaska COVID-19 information page for more information about the virus and how individuals and businesses can protect themselves and others from transmission.
For the most up-to-date case information, see the Alaska Coronavirus Response Hub dashboard. Some data may change as more information comes to light through contact tracing and other public health work.
For questions regarding DHSS COVID response, including mandates and alerts, email covidquestions@alaska.gov. Since DHSS is experiencing a high volume of inquiries, the Frequently Asked Questions webpage can often be the quickest route to an answer regarding testing, travel, health mandates and other COVID-19 information.
For DHSS media inquiries, please contact clinton.bennett@alaska.gov.